Owing to the width of most of the many data tables on this site, it is best viewed from a desktop computer. If you are on a mobile device (phone or tablet), you will obtain a better viewing experience by rotating your device a quarter-turn (to get the so-called “panorama” screen view).
The Owlcroft Baseball-Analysis Site
Baseball team and player performance examined realistically and accurately.
You can get a site directory by clicking on the “hamburger” icon () in the upper right of this page.
Or you can search this site with Google (standard Google-search rules apply).
Search term(s):
The Games-Won Formula
“Tt seemed that the next minute they would discover a solution. Yet it was clear to both of them that the end was still far off, and that the hardest and most complicated part was only just beginning.”
This discussion presumes that you are already familiar with the introductory discussion of probability set forth on the Analysis Basics page of this site. If you haven’t read that material yet, please do so before looking over this one (just click the link in the previous sentence).
Individual baseball games are, obviously, won or lost based on a very clear and simple rule: the team that scores more runs than it gives up by the end of the game wins. Less obvious is that there is a definite and clear relationship between the runs a team scores and gives up over a series of games and the percentage of games it wins in that series (but that of course is a probabilistic relation). Given that fact, if we knew how many runs a team could be expected to score and give up over a season, we could predict with reasonable accuracy how many games they would win in that season.
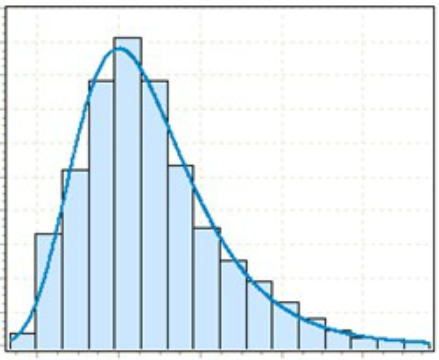
Getting a full-blown probabilistic equation would be a monster problem. To give you an idea of the problems, run-scoring is not a simple bell curve, because it is bounded by a lower limit of zero runs; moreover, it is not a continuous curve, because one can’t score a fraction of a run. Thus, the likelihood of runs looks something like the graph below:
To reckon the probability of Team A scoring more runs than Team B when all that differs on their runs graphs is the exact location of the high point (their average runs per game) is a far-from-simple mathematical exercise, and none of the extant games-won equations really calculate on this basis: they are useful working approximations that happen to have decent accuracy.
(An important aspect of baseball statistics is that in the real world they don’t actually have a very large range of values: for example, once past a few at-bats, no one hits .007 or .731; no team’s seasonal run total is 37 or 23,469; and so on. Because of that narrowness, an equation relating values can be rather drastically wrong overall, but still manage to give tolerably correct answers within that narrow range. To a human, the world looks flat, because the very narrow segment of it we see is curved so slightly we can’t notice it. In mathematical terms, a linear approximation (“linear” meaning a straight line) can work on almost any function if it only has to deal with a very narrow range of values.)
To make this less mystical, consider a team that plays a fairly large number of games against another team or set of teams—in fact, a typical baseball season. If, at the end of that time, the team has scored exactly as many runs as it has given up, it is no great leap of logic to say that on balance they have been neither better nor worse a team than their average opponent: that they would thus be expected to be .500 (or something close to it) in those games.
That gives us the first of the three tests any games-won formula must meet: Test #1 is that at equal numbers of runs scored and runs yielded the formula must predict a .500 win percentage.
Moreover, we certainly feel that if the team has outscored their opponents by a little, they should have won a little more than half their games; and if they outscored them a lot, then they should have won a lot more (and, of course, vice-versa gor scoring fewer runs). Clearly,then, the two further tests that any games-won formula must meet are these: Test #2 is that if we set OR to zero, the formula must predict a 1.000 win percentage; and Test #3 is that if we set R to zero, the formula must predict a zero win percentage.
If you want to see how easily one can construct a games-won equation from sheer simple common sense, well, let’s try it.
Obviously, the crux is the extent to which a team scores more runs than it allows (or vice-versa). Thus, we start with what is commonly called the “run differential”, which is simply: R - OR (which could be positive or negative).
But the size of that differential has to be considered in proportion to what is commonly called the “run environment”. The run environment for a team is simply R + OR: the total runs scored by both teams combined in all of that subject team’s games. To perhaps better see that, if we imagine a league in which the run environment is, say, 6 runs, then obviously any one run is pretty important, and a seasonal average one-run (per game) difference between runs scored and runs allowed will loom large. On the other hand, if the run environment were not 6 runs but, say, 12 runs, then any one run in a game will mean rather less, and a seasonal-average difference of one run per game isn’t as big a factor in determining likely wins.
So now our tentative formula is the run differential proportioned to the run environment, so:
     (R - OR)
W% = ――――――――
     (R + OR)
But at once we see that that can’t be right, because it fails Test #1: when R and OR are equal, it is just zero. But then we realize that this must instead represent the difference between .500 and what the calculated win percentage is—so we just add in that .500 and get:
     (R - OR)
W% = ―――――――― + .500
     (R + OR)
But we still have problems: now it fails Tests #2 and #3: when OR is zero, it predicts a win percentage of 1.500 (obviously impossible), and when R is zero, it predicts a win percentage of -0.500 (equallly impossible). But that is because we forgot that the fraction there is telling us the difference between .500 and the predicted value. Since that difference can never be greater than 0.500 (in either direction, up or down), we need to multiply it by one-half. That gives us:
Next, we remember that any fraction whose top (numerator) and bottom (denominator) are the same always equals 1 (for example, 3/3 or 7/7). So we can write:
 R + OR
―――――――― = 1
 R + OR
We can now substitute that fraction for the “1” in the formula, and get:
           ┌                   ┐
           │ R - OR     R + OR │
W% = 1/2 x │―――――――― + ――――――――│
           │ R + OR     R + OR │
           └                   ┘
And, since both fractions have the same denominator, we can combine them into one fraction:
           ┌                 ┐
           │ R - OR + R + OR │
W% = 1/2 x │―――――――――――――――― │
           │     R + OR      │
           └                 ┘
Next, we let the +OR and the -OR cancel each other out, and get:
           ┌        ┐
           │ R + R  │
W% = 1/2 x │――――――――│
           │ R + OR │
           └        ┘
And that, obviously, is just:
           ┌        ┐
           │   2R   │
W% = 1/2 x │――――――――│
           │ R + OR │
           └        ┘
Finally, we let the 1/2 x 2 be just what it is, 1:
        R
W% = ――――――――
      R + OR
And there, bada-boom, is our tentative formula, all cleaned up, teeth brushed, and smiling.
The proof of a pudding, however, is in the eating: so let’s see what we get if we test that tentative formula. We will use 1,828 team-seasons of data, the MLB records from 1954 to 2024 (inclusive). When we do, we get an average size of error of almost exactly 5 wins (5.0399343544858). That’s not bad—it clearly shows we are on the right track; but it’s somewhat larger than we might like.
Step 3:
At this point, enter Bill James. His insight was to use that basic formula—but with the individual terms both squared.
(A number squared is that number multiplied by itself: 3 squared, usually written 32, is just 3 x 3, or 9, while, say, 72 is 7 x 7, or 49.)
Whether James arrived at that idea by working from the formula shown above or whether he jumped right to what he—and nowadays everyone— mis-calls the “Pythagorean” wins formula, we don’t know. But what he set forth…
         R2
W% = ――――――――――
      R2 + OR2
…works better: its average size of error (using that same historical data) is about three and a quarter wins (3.2483588621444).
After a while, some—including us—wondered if we couldn’t “tune” that exponent of 2 to a yet more satisfactory value.
(Here we have to note that exponents do not have to be integers—whole numbers such as 2 or 3 or 7; they can be anything, such as, say, 3.14156. Such expressions as n3.14156 cannot be easily written out the way n2 can be as n x n, but they can be calculated: many pocket calculators, or mobile-device calculator apps, or desktop software, will gladly crank out the value of, for example, 53.14156—which, our trusty pocket calculator says, is 156.99187.)
So we built some simple software that uses brute-force trial-and-error to optimize that exponent. Here’s how it worked:
It started by trying integer values of 0 to an arbitrarily picked maximum of 10, in integer steps. Not surprisingly, the best result was at 2.
It then tried values of 1.5 to 2.5, in steps of 0.1; the best value was 1.8.
It then tried values of 1.75 to 1.85 in steps of .01; the best value was 1.85.
It then tried 1.845 to 1.855 in steps of .001; the best value was 1.846.
It then tried 1.8455 to 1.865 in steps of .0001; the best value was 1.8455.
then tried 1.84545 to 1.84555 in steps of .00001; and guess what? There was no improvement.
The value of 1.8455 is as good as it gets (for that particular 71-year database). Its 3.1630196936543 percent error size is not a vast improvement over the 3.2483588621444 percent using just 2 for the exponent, but it is an improvement.
The reason there is a final best value is this: when the software calculates projected wins for a given R-OR pair, it always rounds the result to the nearest whole number—because (obviously) a team cannot win a fraction of a game. So whether the projected result in a particular case is, say, 83.317 wins or 83.3166 wins doesn’t matter: the answer will always round to 83 wins. The “stopping point” for exponent accuracy is when all 1,782 team seasons have reached their final whole-number win figures, so that further tuning is pointless.
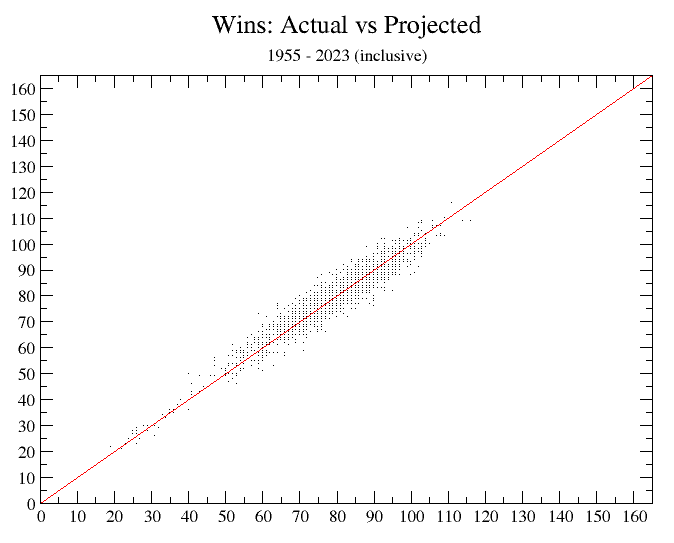
Its average error over those 1,782 team-seasons (again, every team for 1954 through 2024, inclusive) is—as just noted—barely over 3 wins per team-season. Here is a graphic display of those results (again, with all projections rounded to whole numbers):
Note well that the formula works quite as well at the extremes as around the more common values.
Also keep in mind that those figures are, as we keep putting it, the average size of the errors; the actual average error when plus errors and minus errors can cancel out—the per-team-per-season net error— is essentially zero. (The actual figure was 0.12 wins.)


 ) in the upper right of this page.