Owing to the width of most of the many data tables on this site, it is best viewed from a desktop computer. If you are on a mobile device (phone or tablet), you will obtain a better viewing experience by rotating your device a quarter-turn (to get the so-called “panorama” screen view).
The Owlcroft Baseball-Analysis Site
Baseball team and player performance examined realistically and accurately.
You can get a site directory by clicking on the “hamburger” icon () in the upper right of this page.
Or you can search this site with Google (standard Google-search rules apply).
Search term(s):
Proving the TOP: Graphical
“Upon the whole you have proved to be Much as you said you were.”
This page displays the full results in graphical form; those wanting to see the individual data points laid out in tabular form can do so on this alternative proof-results page.
Thousands of Team-Seasons of Baseball Data
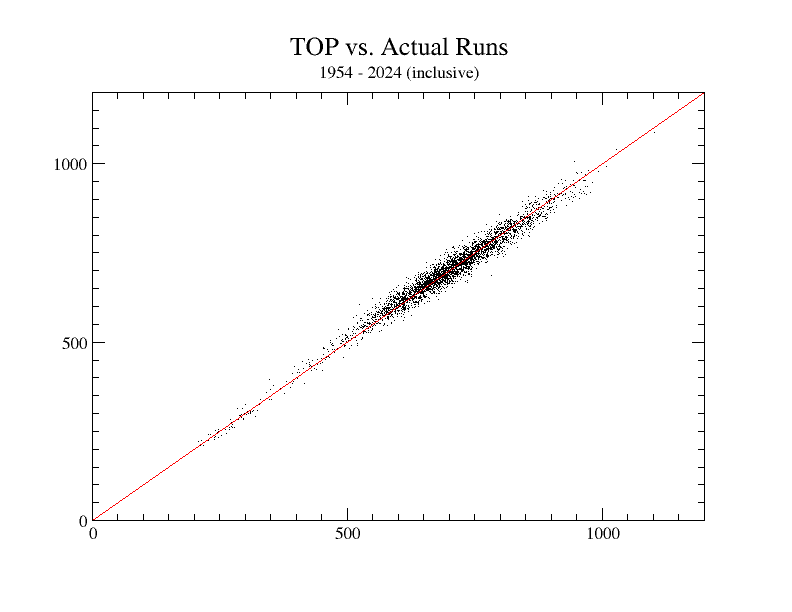
The Graph farther below shows the results of applying the full Owlcroft formula for runs scored and runs allowed (that’s two separate datasets per team per year) to 73 years of actual major-league data: all teams in all years from 1954 through the last completed season, inclusive.
As to why that start-year limit: there was a scoring-rule change (Sacrifice Flies were added back in as a scoring category) between 1953 and 1954; prior years’ data would be incommensurable (granted, the difference would be small, but we are here refining error size down to hundredths of a percent).
The team data used in that formula include: at-bats, walks, hit batsmen, sacrifice hits (bunts), sacrifice flies, singles, doubles, triples, home runs, catcher’s interference calls, stolen bases, caught stealing, double plays, and opponents’ errors allowing an otherwise-out man to reach base safely. All but that last are widely published, and the other can be found by looking (the Baseball Reference site, for one, has it). The methodology of the TOP (projected-runs) calculation is explained elsewhere on this site.
The formula was applied individually to every major-league team’s batting and pitching stats for every year from 1954 through 2024 inclusive (3,656 team-seasons). The average per-team-per-season error rate for the formula is 2.39% (more precisely, 2.3898731037913%). If you know what RMSE (Root Mean Squared Error) signifies, it is 20.578344718047 runs (roughly 20.58).
(The Wikipedia page linked just above contains the following note: “Some researchers have recommended the use of the mean absolute error (MAE) instead of the root mean square deviation. MAE possesses advantages in interpretability over RMSD. MAE is the average of the absolute values of the errors. MAE is fundamentally easier to understand than the square root of the average of squared errors. Furthermore, each error influences MAE in direct proportion to the absolute value of the error, which is not the case for RMSD.”
We cannot use the actual MAE because the data are disparate: in some years there were 162 games in a season, in others 154 games, and in a few years (1981, 1994, 1995, and 2020) considerably fewer. An error size of, say, 20 runs means one thing when the runs average is 300 and quite another when it’s 725; so, when quoting error rates we use the percentage size of error. That is strongly analogous to the MAE error-size measurement, and we agree that it is a more meaningful measure than RMSE; but we include RMSE because some analysts fancy it.
To see how the TOP does, we can compare it to Base Runs, widely held out as the best run-production predictor going:
“[A]s sabermetrician Tom M. Tango points out, base runs models the reality of the run-scoring process ‘significantly better than any other run estimator.’”
—Wikipedia at Base runs.
The Base Runs formula as given by FanGraphs, used over the same multi-decade database described above, gives an average per-team-per-season error rate of 2.9322166414463% (roughly 2.93%) with an RMSE of 25.170050757641 runs (roughly 25.17), significanly worse than the TOP. But we need to be fair; as the FanGraphs article points out, “To date, this B term [where the heavy lifting is done] is the best we have based on empirical work, but it could definitely be refined further in the future.” We did our best to do that refining, and finally got it down to an average per-team-per-season error rate of 2.7406019707512 (roughly 2.74%) with an RMSE of 23.750676599829 runs (roughly 23.75 runs)
For clarity, let’s tabulate those figures:
Method:
Error-Size Percent
Root Mean Squared Error
Raw Base Runs
2.93%
25.17 runs
“Tuned” Base Runs
2.74%
23.75 runs
TOP
2.39%
20.58 runs
So which method is “best”? You make the call.
(You can, if for whatever reason you are so inclined, see the actual TOP team-season-by-team-season data lines, all 3,656 of them (through 2024), at our Proving the TOP: Tabular page.)
Since “a picture is worth a thousand words”, here is a graph of the results: the red line is exact accuracy, and, as you can see, the results are a truly beautiful approximation to that red line.
(Most or all of the Runs totals under 450 or so are from the short-season years mentioned above.)
One thing that is quite important here is that accuracy remains excellent at both extremes, not just around the mid-range area where most of the data bunch up. Not a few other such formulas have good average accuracy numbers, but have a definite tendency to concentrate their errors at either the high or the low end of run-scoring (most often, the high end), indicating that they are not actually tracking well the real mechanisms of run-scoring.
Another important thing is that the errors in the Owlcroft formula are essentially symmetrical: they do not, as so many other formulas’s results do, skew toward over- or under-estimating, which is another marker of whether or not a given formula is tracking the real mechanisms of run-scoring. (Visually, the dots above the red “equals” line and those below it are nicely symmetrical.)
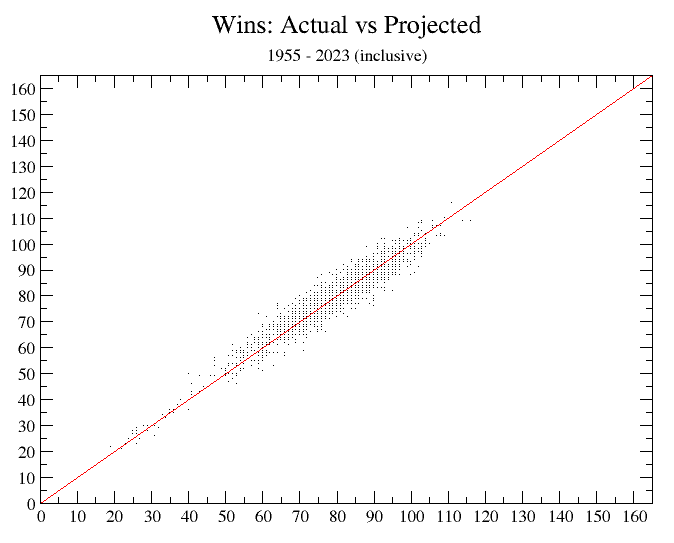
This simply projects expected games won from Runs scored and Opponents’ Runs allowed, as explained elsewhere. The data basis is the same 1954 - 2024 period: 1,828 team-seasons. The average size of error is a hair over 3 wins a team-season (3.16 wins—more exactly, 3.1630196936543 games, but rounded to whole numbers—you can’t win a fraction of a game—it’s 3 games). As with the TOP formula, the results display narrow variation, symmetrical distribution, and accuracy even at the extremes.
(It’s 1,828 team-seasons, not 3,656, because we reckon only one R/OR value per team-season, whereas for run-production calculating we use both batting stats and pitching stats for a given team in a given season. That is because R and OR calculations are separate, independent datasets, whereas Wins from R and OR are a single set, and we don’t want to count them twice.)
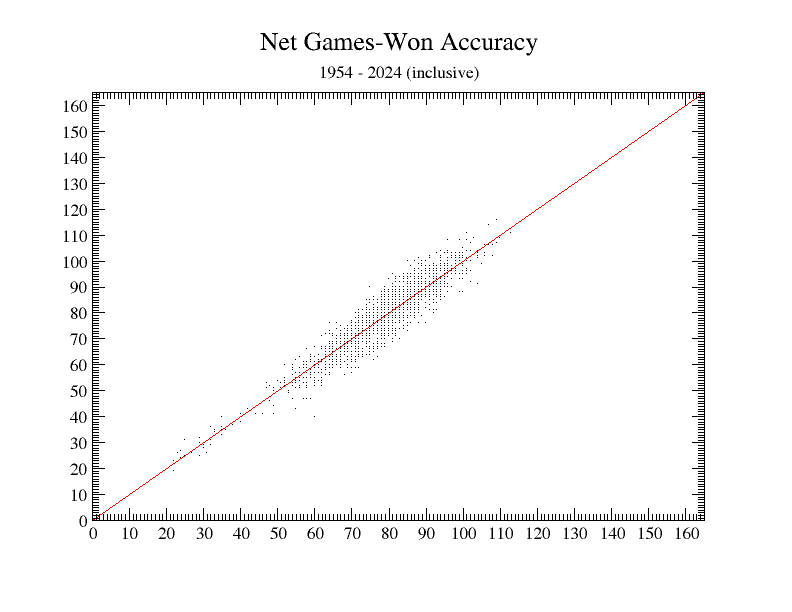
And what is “The Bottom Line”? It is the end product of using the TOP formula to project runs score and runs allowed, then using those projections to reckon projected games won. Remember that the Games-Won formula above was developed using real (not projected) runs data. Using calculated run projections as inputs to the Games-Won formula is the final, net-results step.
When we take that step, what do we get? Using that 71 seasons’ worth of data, we get a average per-team-per-season games-won error of a mere 3.77 games (more exactly, 3.7664113785558). And more than half of those errors are 3 games or fewer. That seems to us a satisfactory result.
Here is a graph of those net-wins results:
As you can see, it’s a bit “fatter” than the bare real-runs games-won graph farther above—but only a bit. Using projected instead of real runs only adds a bit over half a win to the net error.


 ) in the upper right of this page.