The Owlcroft Baseball-Analysis Site
 ) in the upper right of this page.
Or you can search this site with Google (standard Google-search rules apply).
Search term(s):
Owing to the width of most of the many data tables on this site, it is best viewed from a desktop computer. If you are on a mobile device (phone or tablet), you will obtain a better viewing experience by rotating your device a quarter-turn (to get the so-called “panorama” screen view).
 ) in the upper right of this page.
Search term(s):

Quick page jumps:
Since 1994, people in and around baseball—and some not really either (such as the Congress of the United States)—have been, as the British might put it, getting their knickers in a twist over the so-called “explosion” of offense in the game that began season, with virtually all blaming it on some sort of “steroids era”. That last point is so nonsensical yet pervasive that we built a whole web site—which gathered a lot of attention in some circles, some kindly, some not so much—showing where the blame really lies.

The arguments—one can scarcely call them discussions—put forth about that undeniable and significant increase in offensive statistics across the board, which discussions and (presumably) any such “explosion” date from the early 1990s, have produced much heat and little light. In the course of those “discussions”, a great number of red herrings have been dragged across the trail to the truth, the biggest and smelliest being so-called “performance-enhancing drugs”. Retired pitchers in the broadcast booth used to tell you (and some still do) how it’s the ineptitude of the current pitchers; retired batters would tell you (same caveat) that it’s the bigger, stronger hitters of today; or it’s the new crop of ballparks with changed dimensions; or it’s expansion that has “diluted pitching”; or it’s global warming. And, as noted, now—because it’s sensational—we hear it was a plague of steroids. Next, I suppose, will be anti-gravity rays from the planet Mars. And so it goes. Only a few—a very few—will admit that it is, or even might be, the baseball itself.
But, as the eminent physicist Lord Kelvin once famously put it, “Until your knowledge of a subject can be expressed in definite numbers, that knowledge is of a most meager and unsatisfactory kind.” So great a thinker as Aristotle could proclaim that men and women have different numbers of teeth: to an ancient Greek, the idea of just asking Mrs. Aristotle to say “Ahhh” for a moment was—like the idea of a baseball “expert” looking at actual numbers—more or less literally unthinkable. Let us thus see if we can, after all, find some knowledge in the form of definite numbers.
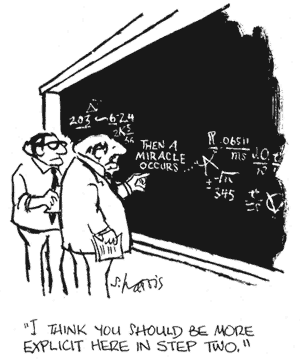
We ask that you be patient as we elucidate this knowledge here, because we want to develop our case slowly enough that we avoid any chance of the sort of problem illustrated at the right.
The very first thing we need to see—what the lawyers would call “the threshold issue”—is whether in fact there was some sort of “explosion” in offense. Since the object of the offense in baseball is to score runs, presumably we can get an idea about overall offense by observing overall run scoring. Let us do so, starting with some very simple raw data: average runs scored per game per season. The easiest way to do that is to look at graphs of run-scoring over the years. It is said that “a picture is worth a thousand words”; but…
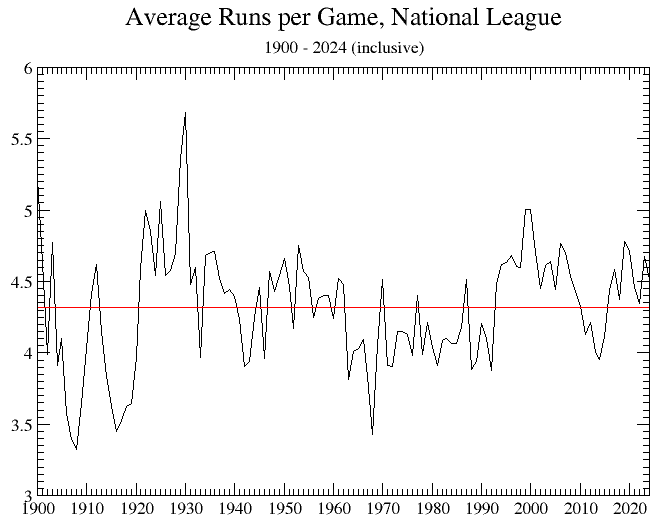
There are issues with graphical displays. Let us illustrate. Below is a graph of run-scoring from 1900 to the present (National League only, to avoid the DH discrepancy). The red line is the 71-year average.

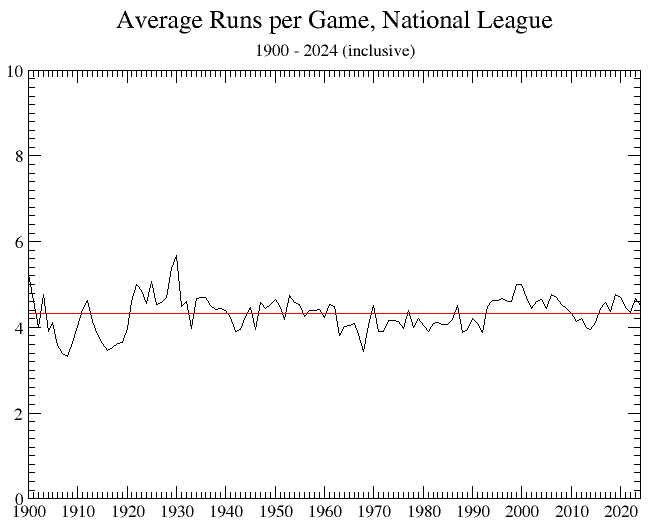
Pretty wild swings there, yes? No; or maybe. Look next at this graph, which shows the same things, only with a different scale.

Not so wild-looking, is it?
What we have shown there is the ease with which data can be presented in ways that conceal more than they reveal, just by choosing the right vertical axis to exaggerate or minimize what the graph maker wants to show (to “prove” any claim such a graph-maker might make).
We can get a somewhat better idea by showing annual average Runs per Games as a fraction of the long-term average. That is the graph below (the colored vertical bars are explained below the graph).

The colored vertical bars come in pairs. Those pairs each encompass a fairly big and rather sudden increase in run scoring, which increase might be termed an “explosion”. Let’s look at them, in chronological order.
The jump up from 1909 (the brown pair of bars) marks the introduction and consequences of the cork-center baseball. The cause of next jump, starting at 1920 (the grey bars) is well-known: the introduction of the notorious “Rabbit Ball”, a ball juicing that resulted from the immense popularity of the emerging hero, Babe Ruth: the Babe’s homers made the turnstiles spin, so what was good for the Babe was made good for everyone. The rise was big in 1920, but it took a while to peak (circa 1922) because it took time for batters to perceive the new environment and start swinging for the fences. (In the pre-Ruthian era, a man was nicknamed “Home Run” Baker because he once hit 12 in a season.)
Scoring levelled off for a while, then spiked again in 1929 (turquoise bars). We don’t know just what happened then, though another juicing seems plausible; but, whatever the cause, the jump was drastic enough that the National League (which is what we’re graphing) publicly announced that starting with 1931 it was deadening the ball (the AL did not then do so): the results can plainly be seen in the drastic fall-off in the early ’30s. The NL announced a further deadening starting with the 1938 season, and that, too, can be plainly seen (and again the AL chose to keep on with its Rabbit Ball).
Following on the heels of the dip in scoring came World War II, wherein vigorous young men were needed on different fields than those in ballparks. At that war’s end, scoring rose back to more or less “normal” levels till 1963, when it markedly dropped and stayed dropped till 1969, when it spiked again (orange bars). That pattern most likely is the effect of the Vietnam War, which—like WWII—took healthy young men to places other than ballparks. (American involvement began well before 1963, but that was the year the American personnel count jump substantially; substantial troop withdrawals began in 1969.)
The next big jump, and an obvious one, started in 1993 and really hit in 1994; and—for reasons we will get to in a moment—was certainly the result of a ball juicing. (Most likely, the new, juicier balls were being introduced during 1993.)
The most recent obvious jump-up started in 2014, and its effects (or possibly a series of further if smaller jumps) kept on through at least 2019, after which things got wanky. MLB bought out Rawlings—the maker of baseballs—in 2018, and there was an immediate drop-off in scoring in 2019 that kept on till 2023. MLB publicly announced that it was de-juicing the baseball as of 2021, but it turned out that in 2021 there were two distinct baseballs in use through the season. Where things will go from here is anyone’s guess.
As to why it is clear that the 1992 – 1994 jump was ball juicing: we will simply point to a page on our steroids-and-baseball site that documents physical examinations of the baseball by experts. And we will have more to say on all this just a little farther on.
There are several factors that can affect run scoring. One example is the definition of the strike zone—a definition that has had official changes as well as unofficial ones.
(In all cases, the strike zone is determined from the batter’s stance as he is prepared to swing at a pitch, not as he initially stands.)
Those are the official changes. There is a clear consensus, however, that umpires do call—and always have called—their personal, individual strike zones regardless of what the Rule Book might say. How that worked in the PITCHf/x era can be seen at David Waldron’s web page Baseball’s Changing Strike Zone. Another interesting item is the 1988 paper “Balls, Strikes, and Norms: Rule Violations and Normative Rules Among Baseball Umpires” (a PDF file) by David W. Rainey of John Carroll University; a key finding was that: “Results suggest that umpires consciously violate official rules.”
(Also important: the strike-zone “box” you see on television broadcasts of ball games is usually a flat, two-dimensional one; that is not the true strike zone—because the zone is actually three dimensional. That is, a pitch is a strike if it passes through the vertical zone over any part of the plate—not just side-to-side but also front-to-back. A pitch with a lot of vertical movement can thus look like a ball in the 2-D TV box, but actually have been in the zone somewhere near the back of the plate. Occasionally broadcasters will show the true 3-D box on close pitches; one wishes they would do that for all pitches. There is a good discussion and illustration of this point, well worth reading, on a Reddit thread.)
Another factor that can materially affect run scoring is defensive-player placement. Now that MLB, in accordance with its modern-day effort to ban intelligence in baseball, has now forbidden infield shifts (because they give smart teams an advantage over dumb ones), placement is less crucial than it used to be, but even in the pre-analytics years it was still a factor.
But the chiefest factor affecting run scoring for the last century or so has been home runs. It was the increase in home runs in 1993 and 1994 that generated the silly and spurious outrage over “performance-enhancing drugs”. (We made an entire web site, Steroids, Other “Drugs”, and Baseball, about that nonsense.) The reason for that runs jump (and some others) over the years) was a change in the actual baseball itself, which is the thesis of this entire page. To measure those effects, and demonstrate the validity of the assertions, we need a way to measure—from game stats, though physical examinations of game balls is also important—the effects of the changes. That measure is the Power Factor, to which we now turn.
The argument here is that changes in the baseball itself are what drove those four or five run-scoring jumps. Remember that what characterizes each is the suddenness of the jump. And if it is the baseball, we should be able to see that more directly than just by overall run scoring, because—as we saw above—other things can have some effect. So how do we examine direct evidences of ball juicing? We use the Power Factor.
What we call the Power Factor (a measure devised by Earnshaw Cook over sixty years ago) is simply the ratio of Total Bases to Hits, or—put another way—the average number of bases per base hit. Trying to measure changes in power using just Total Bases, or Home Runs, or Slugging Average, all fail because they depend on batting average, which in turn depends on things (such as the strike zone) not related to pure power. (We could as well track just home runs per hit, but the two—TB/H and HR/H—track almost exactly, because home runs dominate the Power Factor.) The PF nicely measures the actual carry of a well-struck baseball.
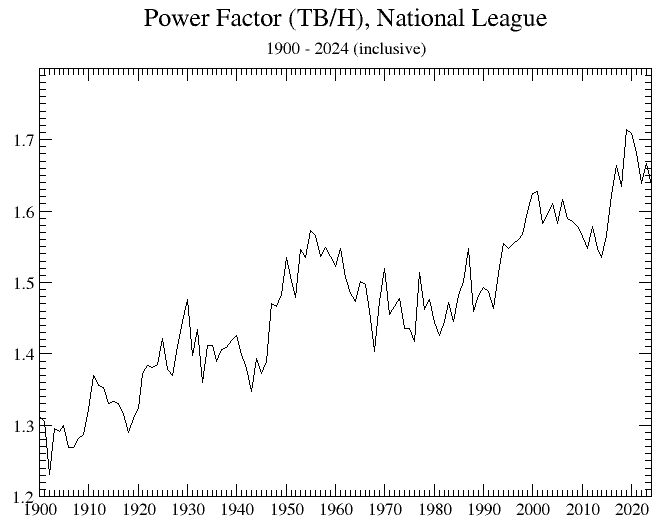
We can start by just graphing the bare Power Factor. As for Runs, we will stick to the National League to avoid the DH discrepancy.

The first thing that jumps out is the clear upward trend over the century and a quarter of “Modern Era” baseball. The second thing, however, is the rather obvious occurrence of sudden jumps at certain points. Here is the same graph with those jumps marked out.

Here is what the vertical lines are demarking, in chronological order (oldest first):
(Not marked out is the acknowledged de-juicing of the National League ball beginning with the 1931 season, but it’s plain to see.)
Let’s now look a bit more closely. First off, it is crystal clear that changes to the ball have happened, and that they have had substantial impacts on the Power Factor, and thus on run scoring. Some of those changes were deliberate and some possibly not. It is critical to keep two things in mind: first, that the “specifications” for major-league baseballs are so loose in tolerances as to be almost a joke; and second, that apparently minor—almost trival-seeming—changes in the ball can have unexpectedly large effects.
(An MLB-sponsored study in 2000 by the University of Massachusetts-Lowell Baseball Research Center stated “two baseballs could meet MLB specifications for construction but one ball could be theoretically hit 49.1 feet further.” Aside from the faulty diction [the wanted word is farther], there it is from MLB’s own hired guns. That same study also reported that “some of the internal components of the dissected samples were slightly out of tolerance on baseballs from each year”, and that almost 7% of the sample balls were under-weight.)
It is by no means a simple matter of just the resilience of the baseball (which is what too many analyses use as their sole criterion). The height and tightness of the stitching seams is very important, as is (a bit surprisingly) the actual thickness of the laces. Then there is the actual size of the ball (which seems to have shrunk slightly in recent years, though still within those ridiculously loose “standards”).
We could go on and on about changes to the ball and their effect, but this is already a long page and there is no need for us to re-invent the wheel: there is lots and lots of expert information readily available. (Most notably, there is the recent work by astrophysicist Dr. Meredith Willis, who has cut up and examined with microscopic care numerous baseballs, with startling results.) Here is a recommended reading list that covers the ground well. (For many of these, the title alone tells the story.)
In short, we feel that the facts make inescapable the conclusion that any “explosion” in scoring—as well as some “implosions”—are mainly due to changes in the physical baseball. (The few exceptions to that “mainly” are societal changes in the availability of healthy young athletes owing to wars.) That MLB has been secretive about the ball†, and has in several instances blatantly lied about changes, is deeply disturbing, though not unexpected, all things considered.
† There are severe penalties—losing one’s job and being barred from the industry—for anyone associated in any way with baseball to smuggle actual baseballs out of a park (presumably for analysis). Nevertheless, numerous employees have risked it—with great precautions worthy of a spy movie—making the discoveries revealed in the links above possible, and bless them for it.
We believe that the material on this page and in the several linked references has more than suffices to prove its proposition, that MLB has repeatedly doctored the ball. We hope you agree.
Advertisement:
Advertisement:
All content copyright © 2002 - 2025 by The Owlcroft Company.
This web page is strictly compliant with the WHATWG (Web Hypertext Application Technology Working Group) HyperText Markup Language (HTML5) Protocol versionless “Living Standard” and the W3C (World Wide Web Consortium) Cascading Style Sheets (CSS3) Protocol v3 — because we care about interoperability. Click on the logos below to test us!
This page was last modified on Friday, 8 November 2024, at 5:49 pm Pacific Time.